Inflation and the Australian office market
In this article, we will examine the historical relationship between inflation and the Australian office sector and its potential implications for rents in the future.
As the world continues to recover from the unprecedented impact of COVID-19, the Australian economy has to adjust to elevated levels of inflation that have not been recorded since the 1990s. The latest Australian headline inflation rate surged to 5.1% in March 2022. This reading is well above the Reserve Bank of Australia’s (RBA) inflation target band of 2% to 3%. In response, the RBA has started lifting the official cash rate to 1.35% in July 2022, from a low of 0.1% in October 2022.
What is the historical relationship between inflation and office rents?
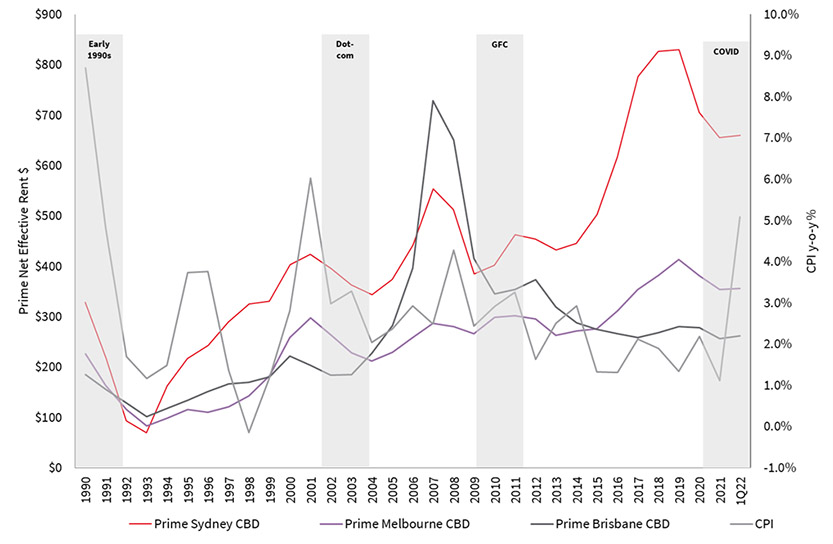
We have analysed an extensive series of Australian Eastern Seaboard CBD office rents and inflation going back to 1990, capturing various periods of inflation spikes which are highlighted in Figure 1. The latest period of elevated inflation was in March 2022, with Prime net effective rents in Sydney CBD at $660, Prime Melbourne CBD at $356, and in Prime Brisbane CBD at $261. Figure 1 also highlights periods where there were corrections in net effective rents, such as the 1990s recession, the 2000 dot-com bubble burst the global financial crisis and the COVID-19 2020 downturn.
Figure 1: CPI vs Australian CBD Net Effective Rent
Source: JLL Research & ABS
So, is there a direct correlation between movements in inflation and the Australian market’s effective rents?
We calculated correlations coefficients in Figure 1 and found no strong correlation between variables for the Australian Eastern Seaboard office markets. The average correlation coefficient between inflation and prime net effective rents across the three CBD markets in Figure 2 over the 1991-2000, 2001-2010 and 2011-1Q22 periods is -1.3%, 23.7%, and -29.4%, respectively. These correlation coefficients are very weak, with similar weak correlation coefficients recorded between inflation and secondary net effective rents across CBD markets.
Figure 2: Correlation between CPI and Net Effective Rent
| 1991-2000 | 2001-2010 | 2011-1Q22 | Total | |
|---|---|---|---|---|
| Prime Sydney CBD | -1.3% | 23.7% | -29.4% | -8.5% |
| Prime Melbourne CBD | 15.8% | 53.1% | -16.7% | 5.3% |
| Prime Brisbane CBD | 6.1% | -9.7% | 6.0% | 3.8% |
| Secondary Sydney CBD | 40.1% | 56.6% | -30.2% | 17.6% |
| Secondary Melbourne CBD | -8.4% | 14.3% | -26.9% | -3.4% |
| Secondary Brisbane CBD | 33.7% | -11.9% | 4.7% | 10.4% |
Source: JLL Research & ABS
Why do these weak relationships exist? One potential explanation is the nature of lease structures across the Australian office market. Most leases in Australia have fixed escalations, with typical escalations across Sydney, Melbourne and Brisbane CBD markets, ranging from 3.25% to 4.00%. While escalations are inflation-linked in the Australian office landscape, these inflation-linked leases anecdotally make up a tiny proportion of overall leases in the market.
We are projecting that prime net effective rents have reached their cyclical low across Sydney, Melbourne and Brisbane CBD markets in 2022, and effective rents will gradually recover over the medium term. This recovery is unlikely to be driven by rising inflation but more so by improved leasing activity from the lows of 2020.


